Skip to content
Tara Zepel

Data + Communication + Design

  • Home
  • About
  • Articles
  • Teaching
  • Projects
  • Contact

Data Visualization

World Population Growth
Posted inData Visualization Design

World Population Growth

Infographic designed to illustrate the predicted change in population growth between 2010 and 2030.
Read More
February 11, 2019Posted inData Visualization, Design
Strain Prints
Posted inData Visualization Design

Strain Prints

The strain prints you see below were designed for OutCo, a large-scale medical cannabis producer in San Diego, CA. The graphic adapts the companies logo to…
Read More
August 30, 2018Posted inData Visualization, Design
2008 U.S. Presidential Campaign Ads
Posted inData Visualization

2008 U.S. Presidential Campaign Ads

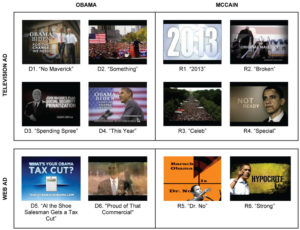
  OVERVIEW: This project analyzes the visual style of 12 video advertisements from the U.S. Presidential Campaign and compares them in terms of candidate and broadcast medium…
Read More
July 16, 2016Posted inData Visualization
The N^3 Report
Posted inData Visualization

The N^3 Report

  Hi-Res Image (7MB) Each block within the larger montage is an introductory segment montage sampled at 30 frames per second. Each row shows a 5…
Read More
May 18, 2016Posted inData Visualization
ImagePlot Visualization Software: Exploring Patterns in Image and Video Sets
Posted inData Visualization

ImagePlot Visualization Software: Exploring Patterns in Image and Video Sets

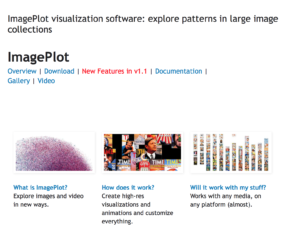
ImagePlot is a free software tool that allows users to visualization collections of images and video of any size. It was developed by the Software Studies…
Read More
May 11, 2016Posted inData Visualization
Copyright © 2023 — Tara Zepel | Demo site of Sinatra WordPress Theme
Scroll to Top